Research
Through our own research and in partnership with other sector organisations, we provide insights for our members to support the delivery of commercial and campus services and the student and campus experience. Members can also find relevant HE and business sector research in our Resources.
Members' Resource Library
2026 CUBO Benchmarking Report
Key Findings:
• Commercial income remains resilient, with an average total commercial income of £35.1 million per institution in 2024/25, up 4% from 2023/24.
• Growth is revenue‑led, but margins remain under pressure due to staffing, utilities and food costs
• Accommodation remains the dominant revenue stream, accounting for 69% of commercial income.
• Catering income decreased by 2%, average catering income per institution was £4.67m
• Conferencing revenue decreased across dedicated and non-dedicated conference spaces.
• Sports services income grew by 8%, driven by increased non-student memberships and higher membership prices.
• Labour & food margins broadly flat year‑on‑year
• Residence Life Programmes 198,000 students engaged across 45 institutions
Download the Executive Summary
CUBO Members can access the full summary report via the Knowledge Hub. If you are not a CUBO member but would like to see the full summary report, please get in touch.
2025 CUBO GSL Insights Report
GSL and CUBO published their third insight report in June 2025, exploring what shapes student belonging, wellbeing, and satisfaction in student accommodation across the UK and Ireland.
Drawing on data from over 48,000 student responses in the GSL Index Spring 2025 wave, this report reveals:
- How residence life can make or break the student experience
- Why moving-in day matters
- Which cohorts are being unintentionally left behind
- What students really want from extracurricular activities
...and much more. Read the full report here.
2025 CUBO Benchmarking Report
Key Findings:
• Commercial income remains resilient, with an average total commercial income of £33.8 million per institution in 2023/24, up 2% from 2022/23.
• Accommodation remains the dominant revenue stream, accounting for 67% of commercial income, despite a 1% decline in residential income linked to a drop in student numbers.
• Catering income grew by 2%, reaching an average of £4.77 million per institution, although universities continue to absorb inflationary pressures rather than passing them directly to students.
• Conferencing revenue increased by 9%, reflecting growing demand, with the UK conference and events market forecasted to reach £25 billion by 2026.
• Sports services income grew by 10%, driven by increased non-student memberships and higher membership prices.
• Operating costs continue to rise, with staff wages increasing by an average of 7% and soft facilities management costs up 17% year-on-year.
Download the Executive Summary
CUBO Members can access the full summary report via the Knowledge Hub. If you are not a CUBO member but would like to see the full summary report, please get in touch.
Download the Full Report
2023-24 CUBO Benchmarking Report
Key findings:
- Elements of commercial services are yet to recover to pre-Covid levels, due to changes in working and social behaviour, and ongoing external cost pressures
- Average total commercial income in 2022/23 equated to £30.8m per institution, up on 2021/22 (£23.6m) and pre-pandemic values in 2018/19 (£23.2m)
- Residential income is 70% of total commercial income, down from 79% in 2021/22 and 84% in 2020/21.
- Catering accounted for 15%, up from 7% the previous year. Average revenues are up 35% to £4.69m, although campus footfall is still impacted by hybrid working and performance is not back to pre-pandemic levels, when catering income accounted for 22%
- Residential income averaged £21.8m per institution.
- Occupancy figures for 2022/23 averaged 96%, up from 92% in 2021/22 and in line with pre-Covid levels (95% in 2018/19). However, 2023/4 saw average occupancy drop to 93%, reflecting the dip in student numbers reported across the sector
- Modal rents have increased YOY by 4% for undergraduates and 2% for postgraduates for 2022/23, with increases being driven largely by the middle and upper-middle price tiers
- Staff costs have increased, with catering, cleaning, security and portering staff costs averaging 4-7% increases in 2022/23, following 7-12% increases in 2021/22
- The average cost per head of a residence life programme was £28 per head, up from £23 per head in 2021/22
- Average income from sport was £2.1m in 2022/23, compared to £1.9m in 2021/22 representing an increase of 11%. This aligns with a growth in sport membership, which averaged 6,871per institution in 2022/23 - an increase of 13% YOY
Download the full report
2024 CUBO Student Living Insight Report
GSL and CUBO published their second insight report in June 2024. It provides an analysis of the student accommodation landscape in the UK and Ireland, with a particular focus on vulnerable student cohorts, including students with disabilities, neurodivergent students, those from ethnic minorities, and LGBTQI+ students.
Key findings
- Student satisfaction levels overall continue to grow, and the gap between university and private halls has closed further by another 2%
- The cost of living crisis is affecting students more than ever, with the number reporting struggling with having enough money to get by increasing to 36%
- Vulnerable students generally report a less positive accommodation experience compared to their peers
- Staff welcome is rated positively by vulnerable groups, but the welcome from other students are rated less favourably
- Students with disabilities and neurodivergent students face significant challenges, particularly related to accessibility and sensory issues
- Poorly managed maintenance, in particular of lifts, is a key cause of distress for students, particularly for those with a disability and those who are neurodivergent
- Financial burdens are higher for students with disabilities due to additional costs associated with accessible accommodation
Download the full report
2023 CUBO Student Living Insight Report
This new report from GSL and CUBO published in July 2023 explores how different student cohorts rate, choose and experience their accommodation. It considers the national picture and performance by mission group before delving deeper into the international student accommodation experience, with particular focus on the key markets of China, India and Nigeria.
Key findings
- Student satisfaction levels are now higher than pre-Covid and the gap between university and private halls is closing
- More students than ever say their accommodation offers good value for money
- Accommodation is more important than ever, especially for international students
- Students from GuildHE university halls are the most satisfied overall with their student accommodation
- A one size fits all approach will not work given the diversity of the international student community
- Students have increasingly high expectations and view their accommodation through a consumer lens
- There is a gap between student expectations and reality in terms of range and quality of facilities in accommodation
- Wellbeing support needs continued prioritisation as different student groups struggle in different areas
- Social events are a key driver of satisfaction for many international students, yet are not meeting expectations
Download the full report
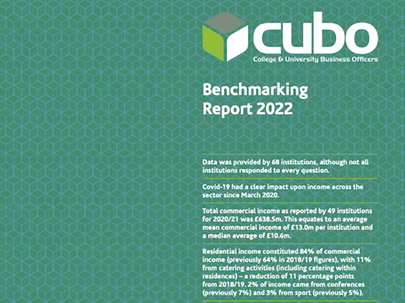
2022 CUBO Benchmarking Report
Key findings
- Data was provided by 68 institutions, although not all institutions responded to every question.
- Covid-19 had a clear impact upon income across the sector since March 2020.
- Total commercial income as reported by 49 institutions for 2020/21 was £638.5m. This equates to an average mean commercial income of £13.0m per institution and a median average of £10.6m.
- Residential income constituted 84% of commercial income (previously 64% in 2018/19 figures), with 11% from catering activities (including catering within residences) – a reduction of 11 percentage points from 2018/19. 2% of income came from conferences (previously 7%) and 3% from sport (previously 5%).
- Total residential income of £535.5m was reported for 2020/21 by 37 institutions. The average income was £14.5m.
- Occupancy figures, which represent student headcount in beds during the contract period, are much lower than those recorded in 2018/19 where average occupancy was 95%. In 2020/21, 40 institutions reported data with an average occupancy at 81%.
- Comparing the data to the 2018/19 figures for self- catered rooms (twin and double data not available) shows an increase of £16 a week in average rent for studio rooms and ensuite rooms and £5 for standard rooms. This represents an increase of 9%, 11% and 4% respectively.
- New questions were added in 2020/21 to capture information around residence life programmes. On average, programmes were accessed by 47% of students (mean) and 43% of students (median) – although this ranged from 8% to 100% of students being engaged across the year.
- The average cost per head of residence life programmes was £34 (mean) and £14 (median).
Download the full report
2019 CUBO Campus Experience Survey
The first step in our ambitious plan to scope the “campus experience” and understand the importance of different campus elements and services in attracting and supporting students, as well as wider university missions. Heads of commercial services provided a self-assessment of their campus performance and data on investment in infrastructure and services.
Key findings
- Universities plan to invest hundreds of millions in campuses in the next five years.
- 60% were very proud of their campuses, but less than 10% thought they worked well for the local community.
- For every university the campus experience was vital to attracting new students, but those with multiple campuses were four times less likely to say they showcased themselves well.
- Only 20% strongly agreed that their university was developing “smart campus technology”: 40% disagreed
- Half of respondents said more than 80% of students were guaranteed their first preference of residence
- The highest rated service was sport (average 7.54 out of 10), then residences (7.42), catering (6.86) and retail (5.86).
- Campus design and how the campus is being used were less well rated.
Download the full report
2019 CUBO Benchmarking Survey
Key Findings:
- Data was provided by 53 institutions, with 31 responding to both parts of the survey.
- Total commercial income across 36 institutions providing data was £835.9m in 2018/19.
- Residential income comprised 64% of the total, 25% from catering, 7% from conferences and 5% from sport.
- Residential income was of £532.3m was reported for the 2018/19 year by 30 institutions, and the average income excluding 1 small entry was £18.4m.
- Total catering income from the 33 institutions reporting their activities was £208.6m in 2018/19. The average income in this area was £6.3m.
- Conferencing income across the 26 institutions who provided data was £54.8m, an average of £2.1m per institution.
- Information has been provided by 24 institutions on their sports offer. Total income from the group was £40.3m, with an average income of £1.8m.
- Average commercial income figure (excluding sports income to draw a comparison) was £22.7m in 2018/19 up from £20.5m in 2017/18, an 11% average rise.
Download the full report
2018 CUBO Benchmarking Survey
Our annual benchmarking collects data and analyses trends in commercial activity across accommodation, catering, retail and conferencing. Universities that participate receive the full aggregate data.
Key findings
- Total commercial income reported by the 29 member institutions was £594.1m in 2016-17, including rental income from residences and from catering activities. This equates to an average commercial income of £20.5m per institution.
- The report shows accommodation representing around 75% of all income, with catering at 17% and conferencing at 8%. Total commercial income is up 3% on the previous year.
- Conference income of £48.6m was reported by 25 members, equating to an average of £1.9m of revenue across the group.
- The modal price for a catered standard room in 2017/18 was in the £140-£149 rent bracket, while the modal en-suite catered cost was £180-189 per week.
Download the full report